


On 4 July 2024, people across the UK went to the polls to vote in a general election. The result saw a large UK majority for the Labour Party, which won 411 out of 650 seats.
In Wales, Labour won 27 out of 32 seats. Plaid Cymru won 4 seats, while the Liberal Democrats won 1.
This article looks at the results in Wales in more detail, covering vote percentages and turnout, as well as taking a closer look at the performance of all parties.
Seats won
Figure 1: Numbers of seats won by party
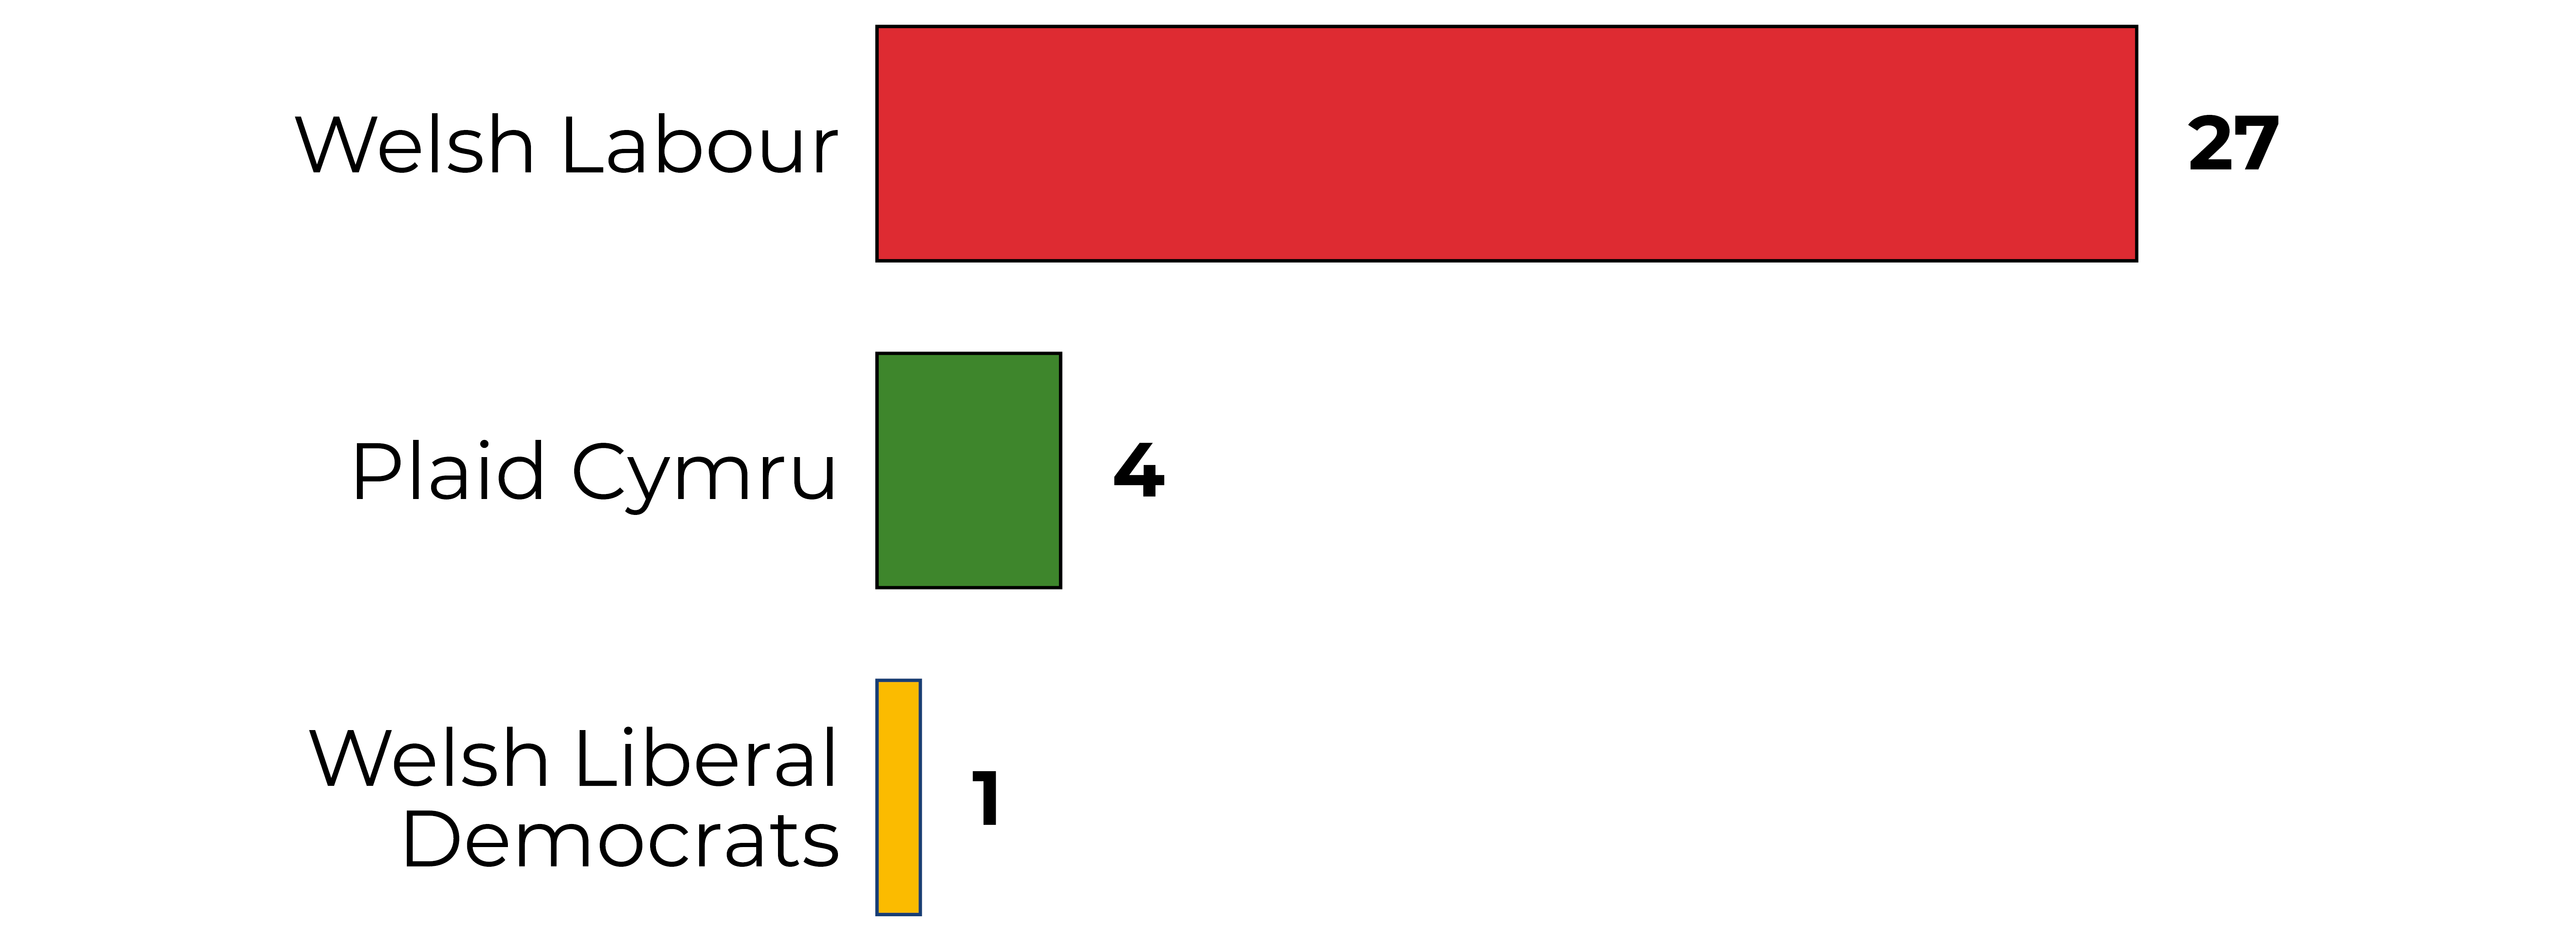
Source: BBC
Labour won a large majority (84%) of seats in Wales. For the first time since 2001, the Conservatives did not win any seats.
It’s not possible to do a direct comparison with seat numbers won in 2019, as at that election Wales elected 40 MPs (as opposed to 32 this time).
This reduction in MPs happened after the Boundary Commission for Wales conducted a review of parliamentary constituencies, in line with a new requirement to (roughly) equalise the size of constituencies (with the exception of the ’protected constituency’ Ynys Môn). The election on 4 July was the first time these new constituencies have been in place.
Figure 2: Seats won by party since 2015
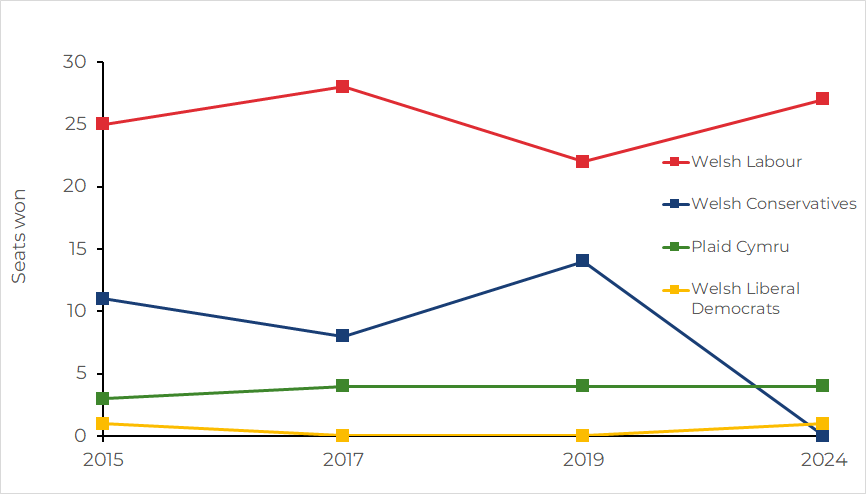
Source: House of Commons Library 2015 / House of Commons Library 2017 / House of Commons Library 2019 / House of Commons Library 2024
The chart shows, Labour has consistently won a majority of seats available in Wales at UK general elections. The Conservatives have seen the most volatility in terms of seat numbers; at this election, the party lost all 14 seats won in 2019.
Whilst there was a reduction in overall seat numbers in Wales, Labour won 5 more seats than in 2019, and Plaid Cymru won the same number of seats as at the previous two elections. The Liberal Democrats won their first seat at a general election since 2015 (Jane Dodds won the Brecon and Radnorshire by-election in 2019).
Mapping it out
Taking the results above, here’s how the constituency map of Wales looks after the election.
Figure 3: 2024 Constituency map of Wales
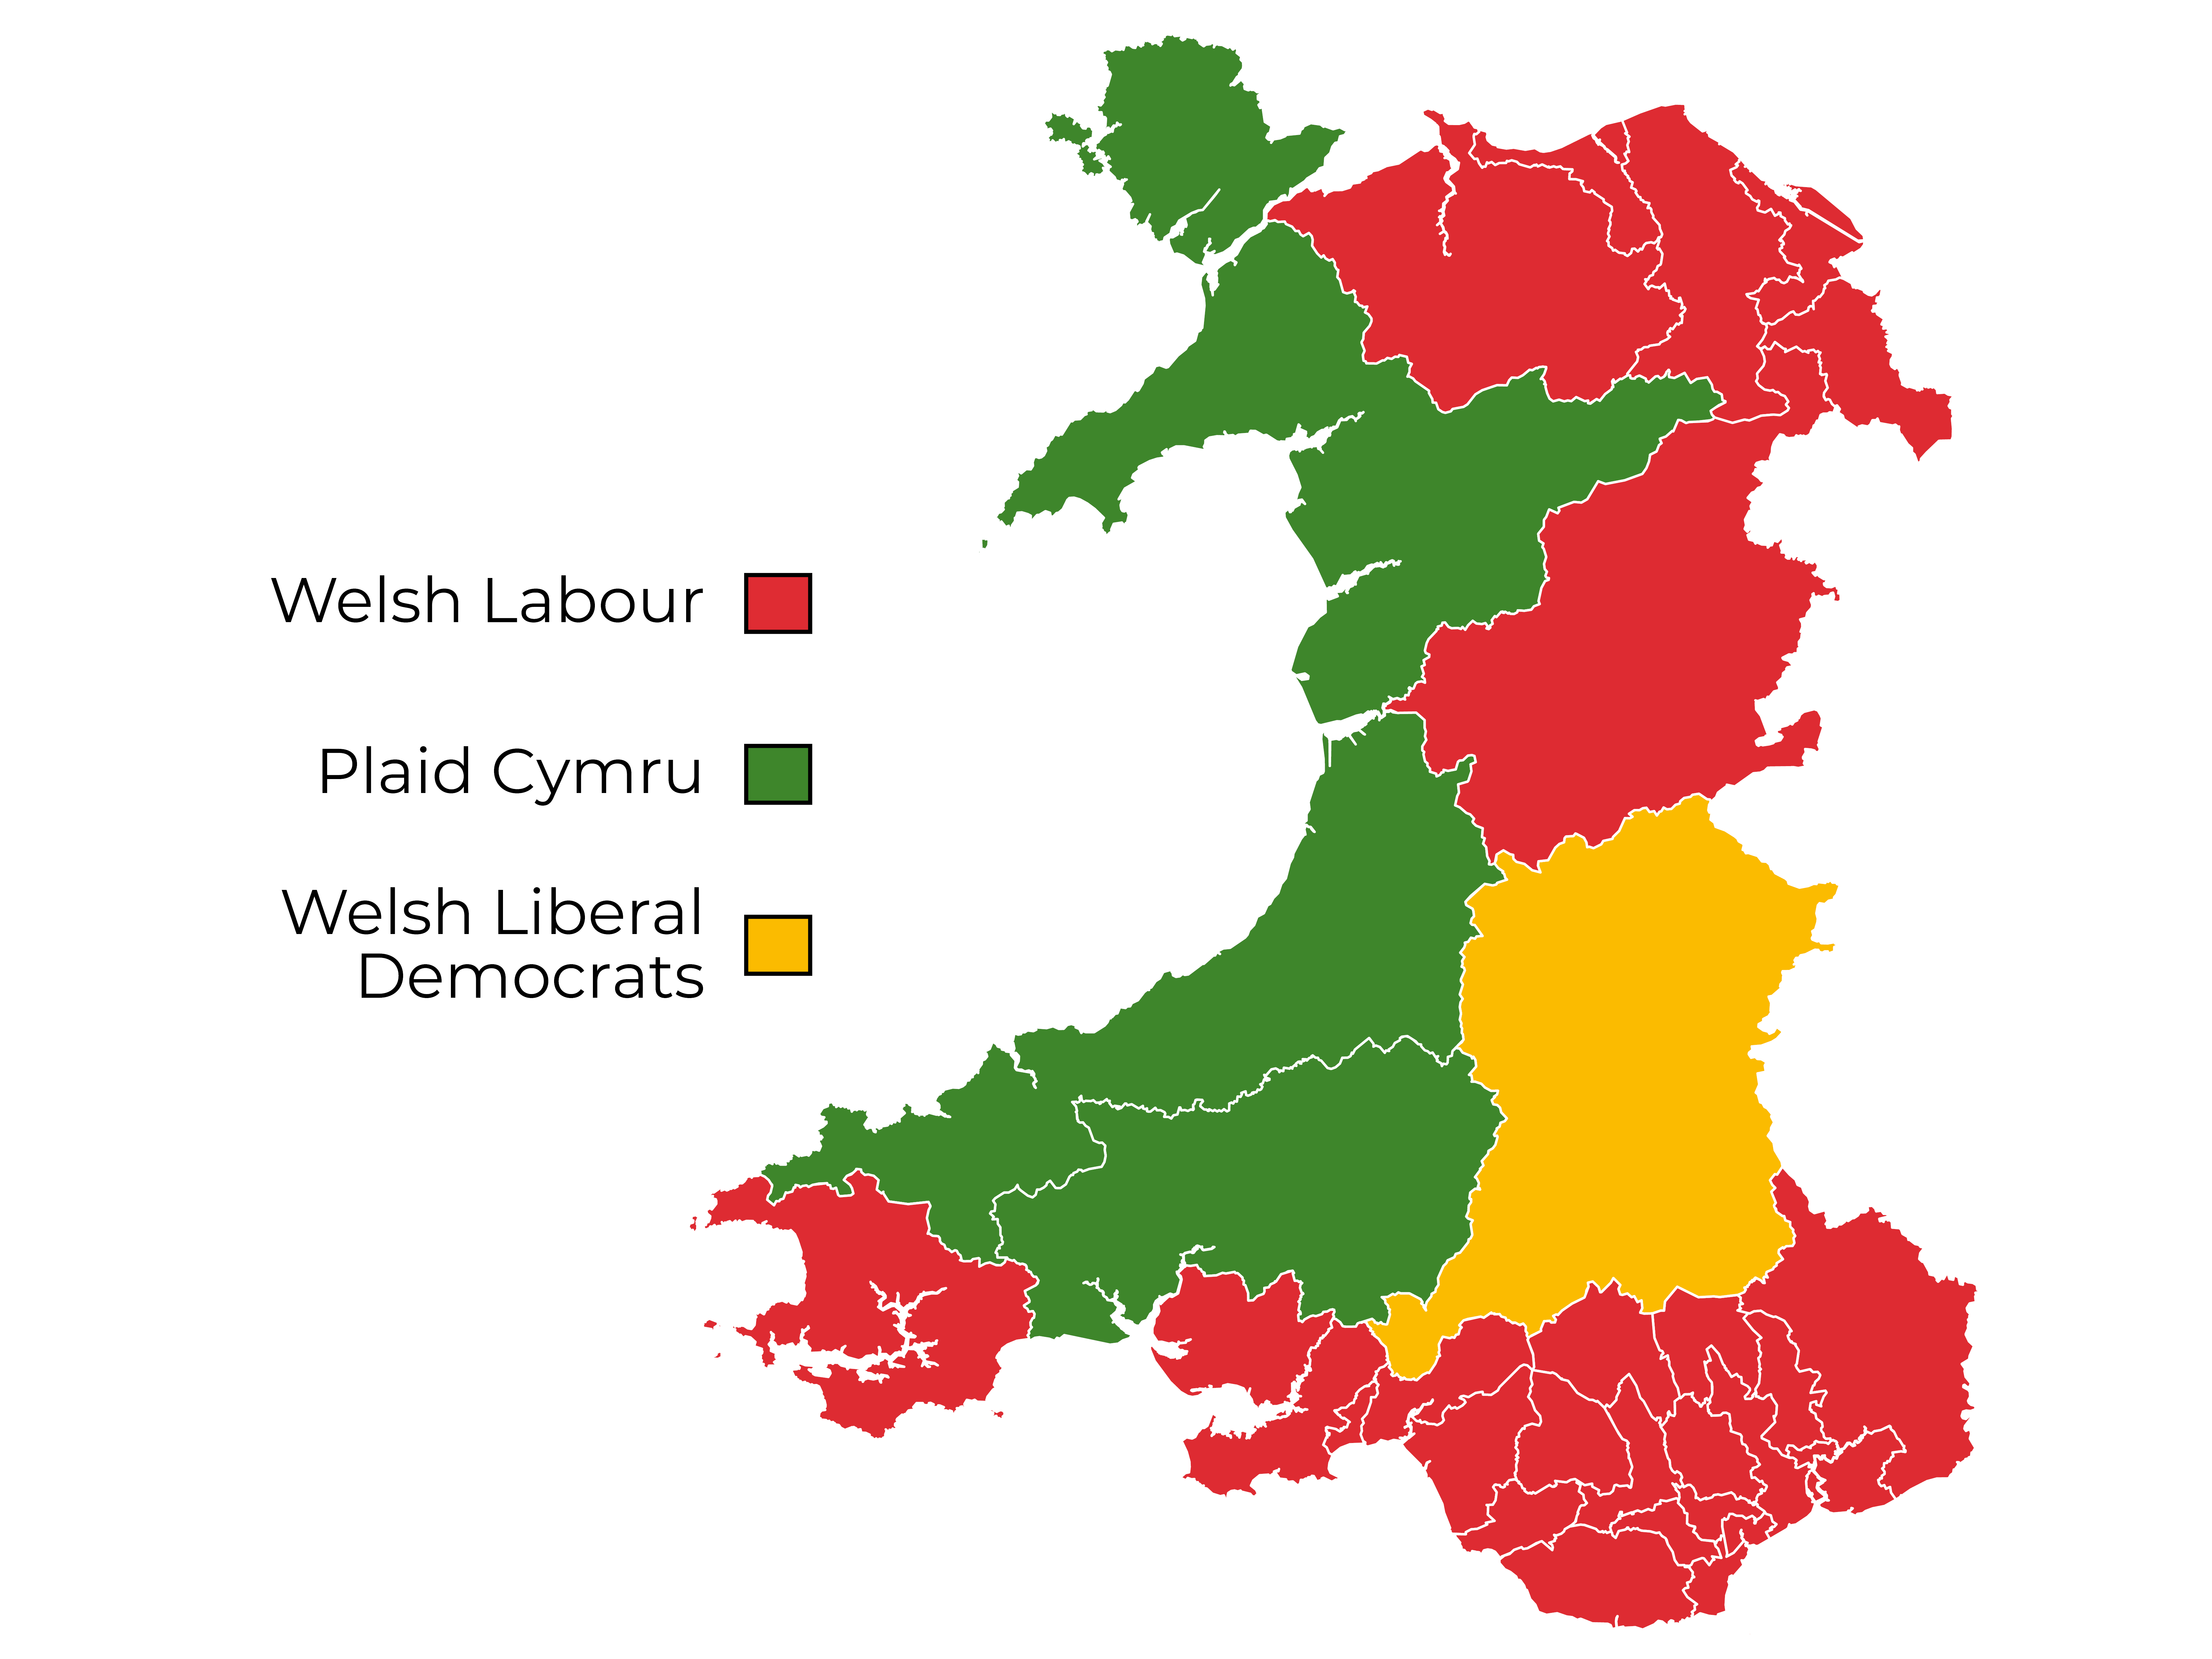
Source: House of Commons Library
As UK general elections use a First Past the Post electoral system, one MP is elected per constituency. However, considering which party finished second can help to provide a more detailed picture of how people voted.
Figure 4: Constituencies coloured with second placed parties
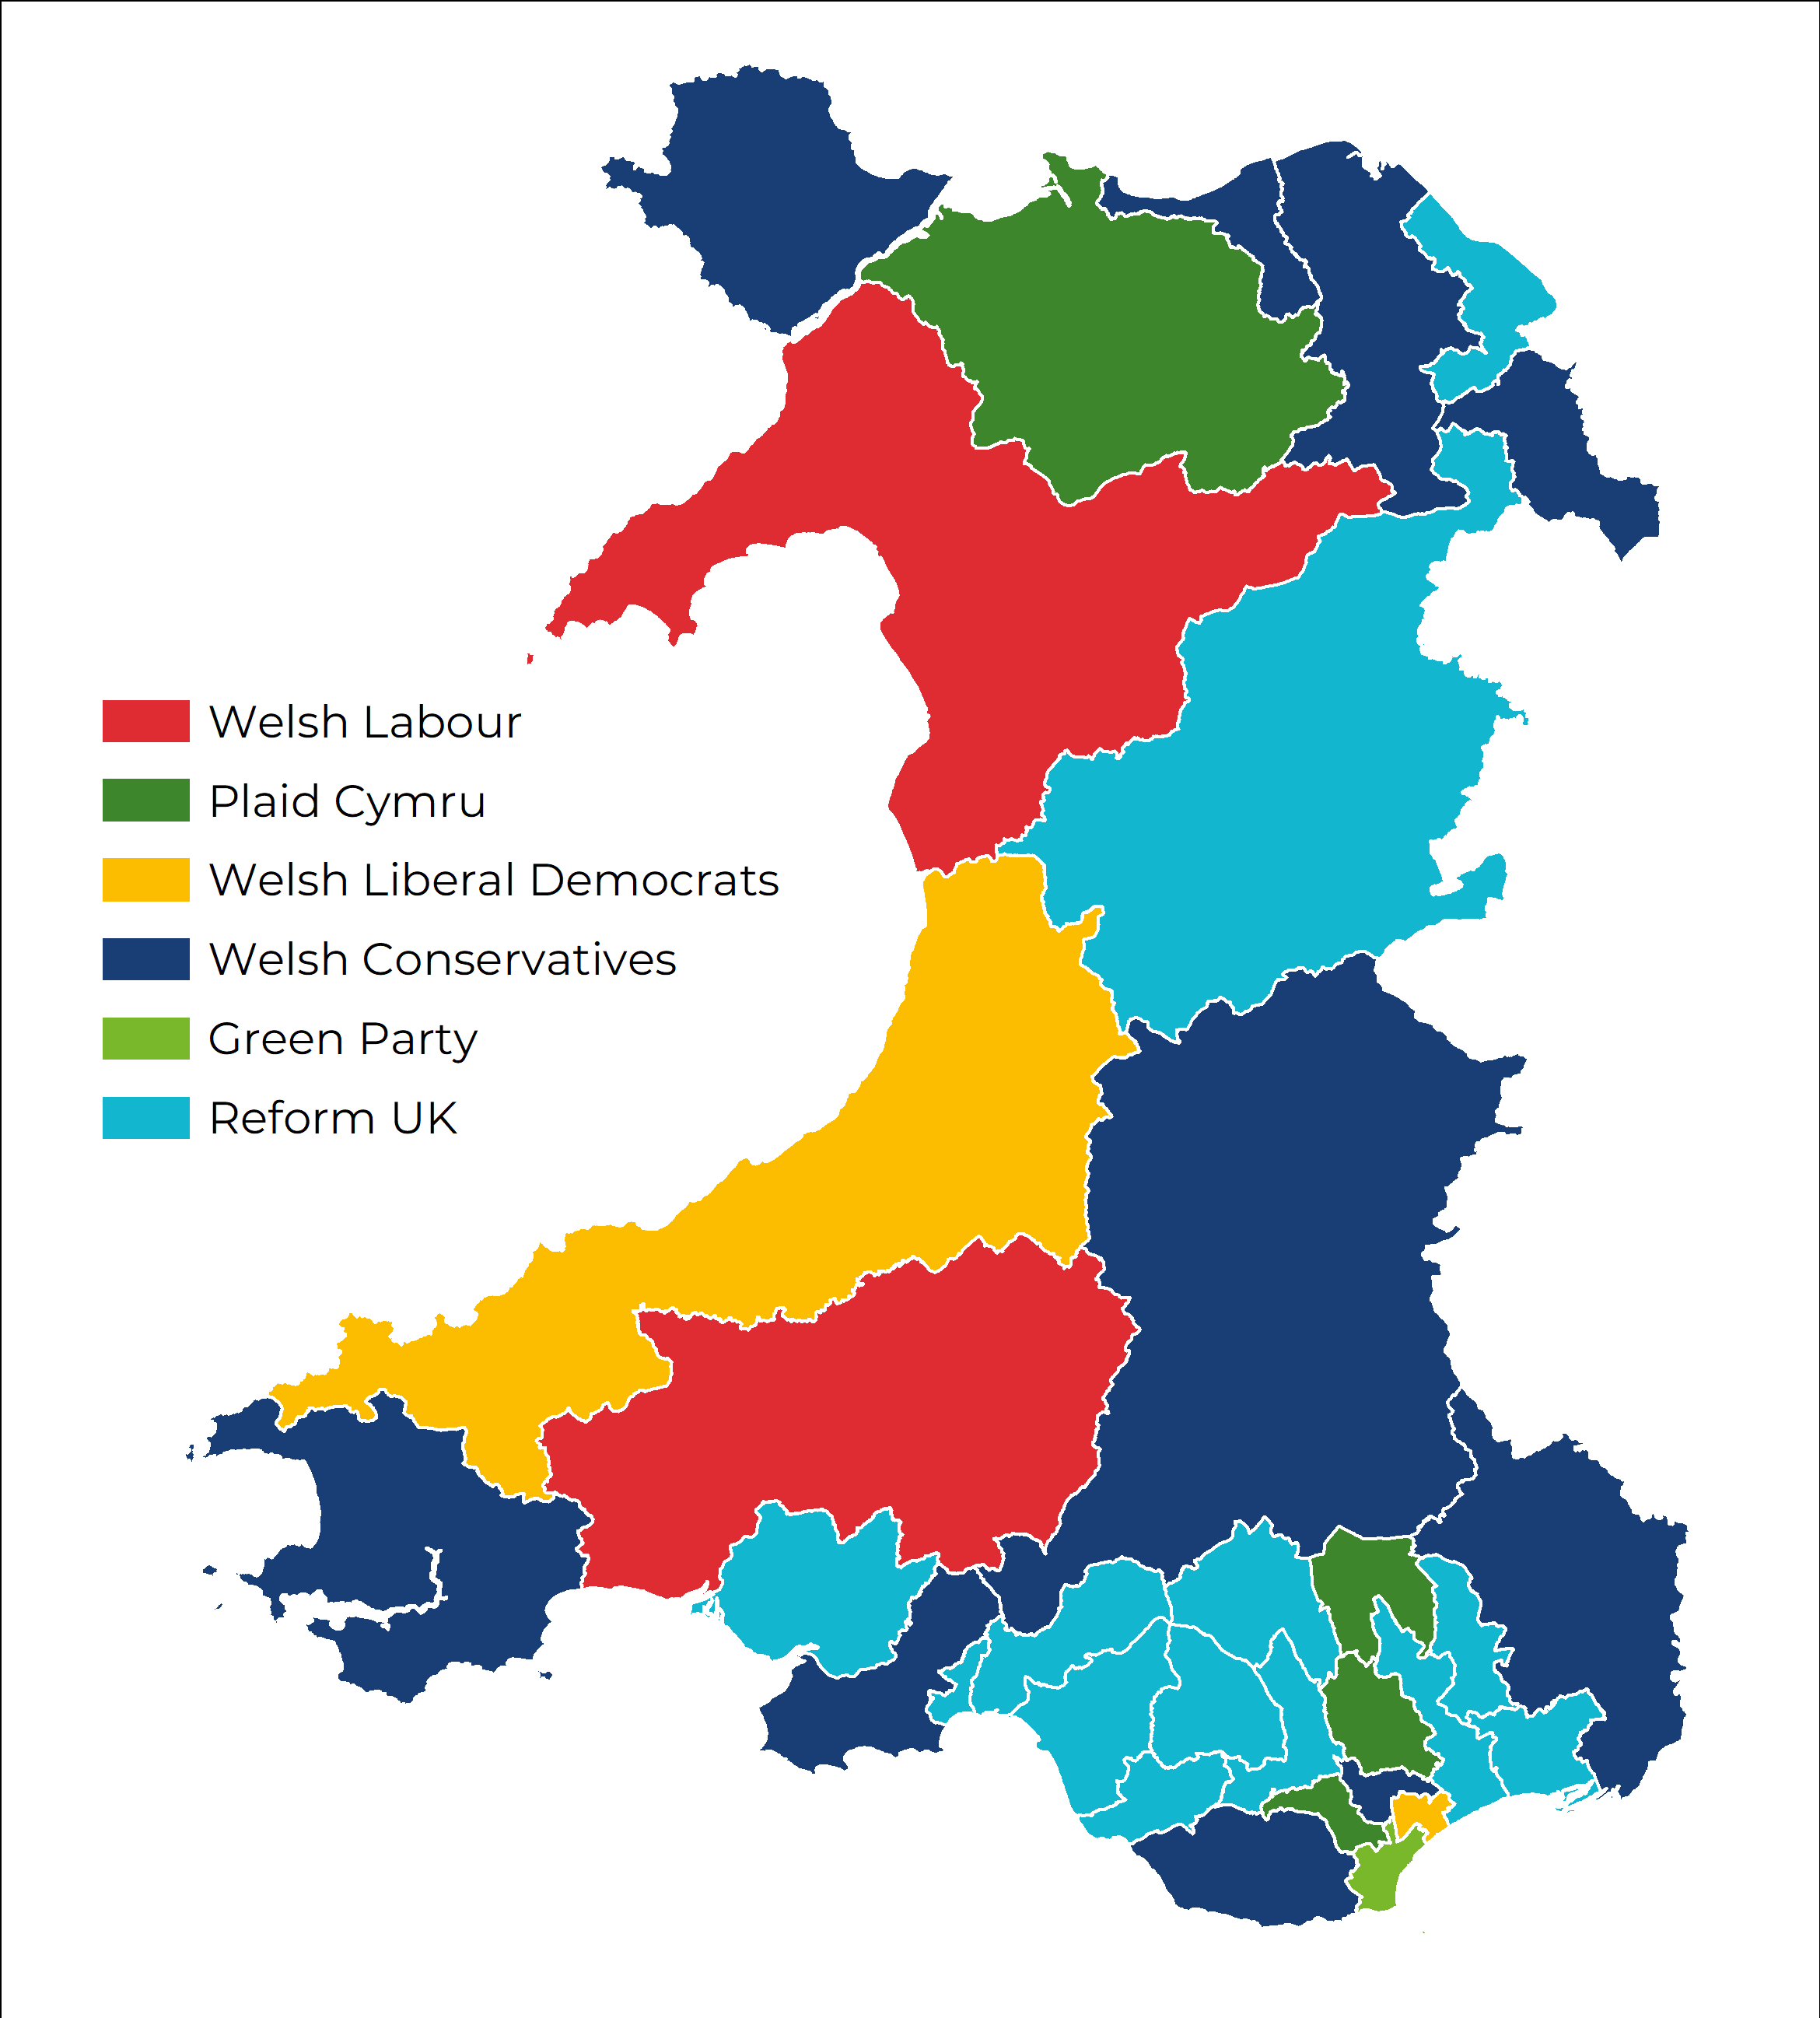
Source: House of Commons Library
Though the party did not win a seat, Reform UK finished second in 13 constituencies, including a considerable number of the south Wales valleys seats.
The Conservatives finished second in 10 seats, whilst Plaid Cymru finished second in 4. Labour and the Liberal Democrats both finished second in 2 seats, whilst the Green Party was the closest challenger in 1 constituency: Cardiff South and Penarth.
It’s worth noting that results were close between second, third and sometimes fourth-placed parties in several constituencies, and that this closeness is not reflected in the above map.
Votes cast
Figure 5: Party vote share and total votes
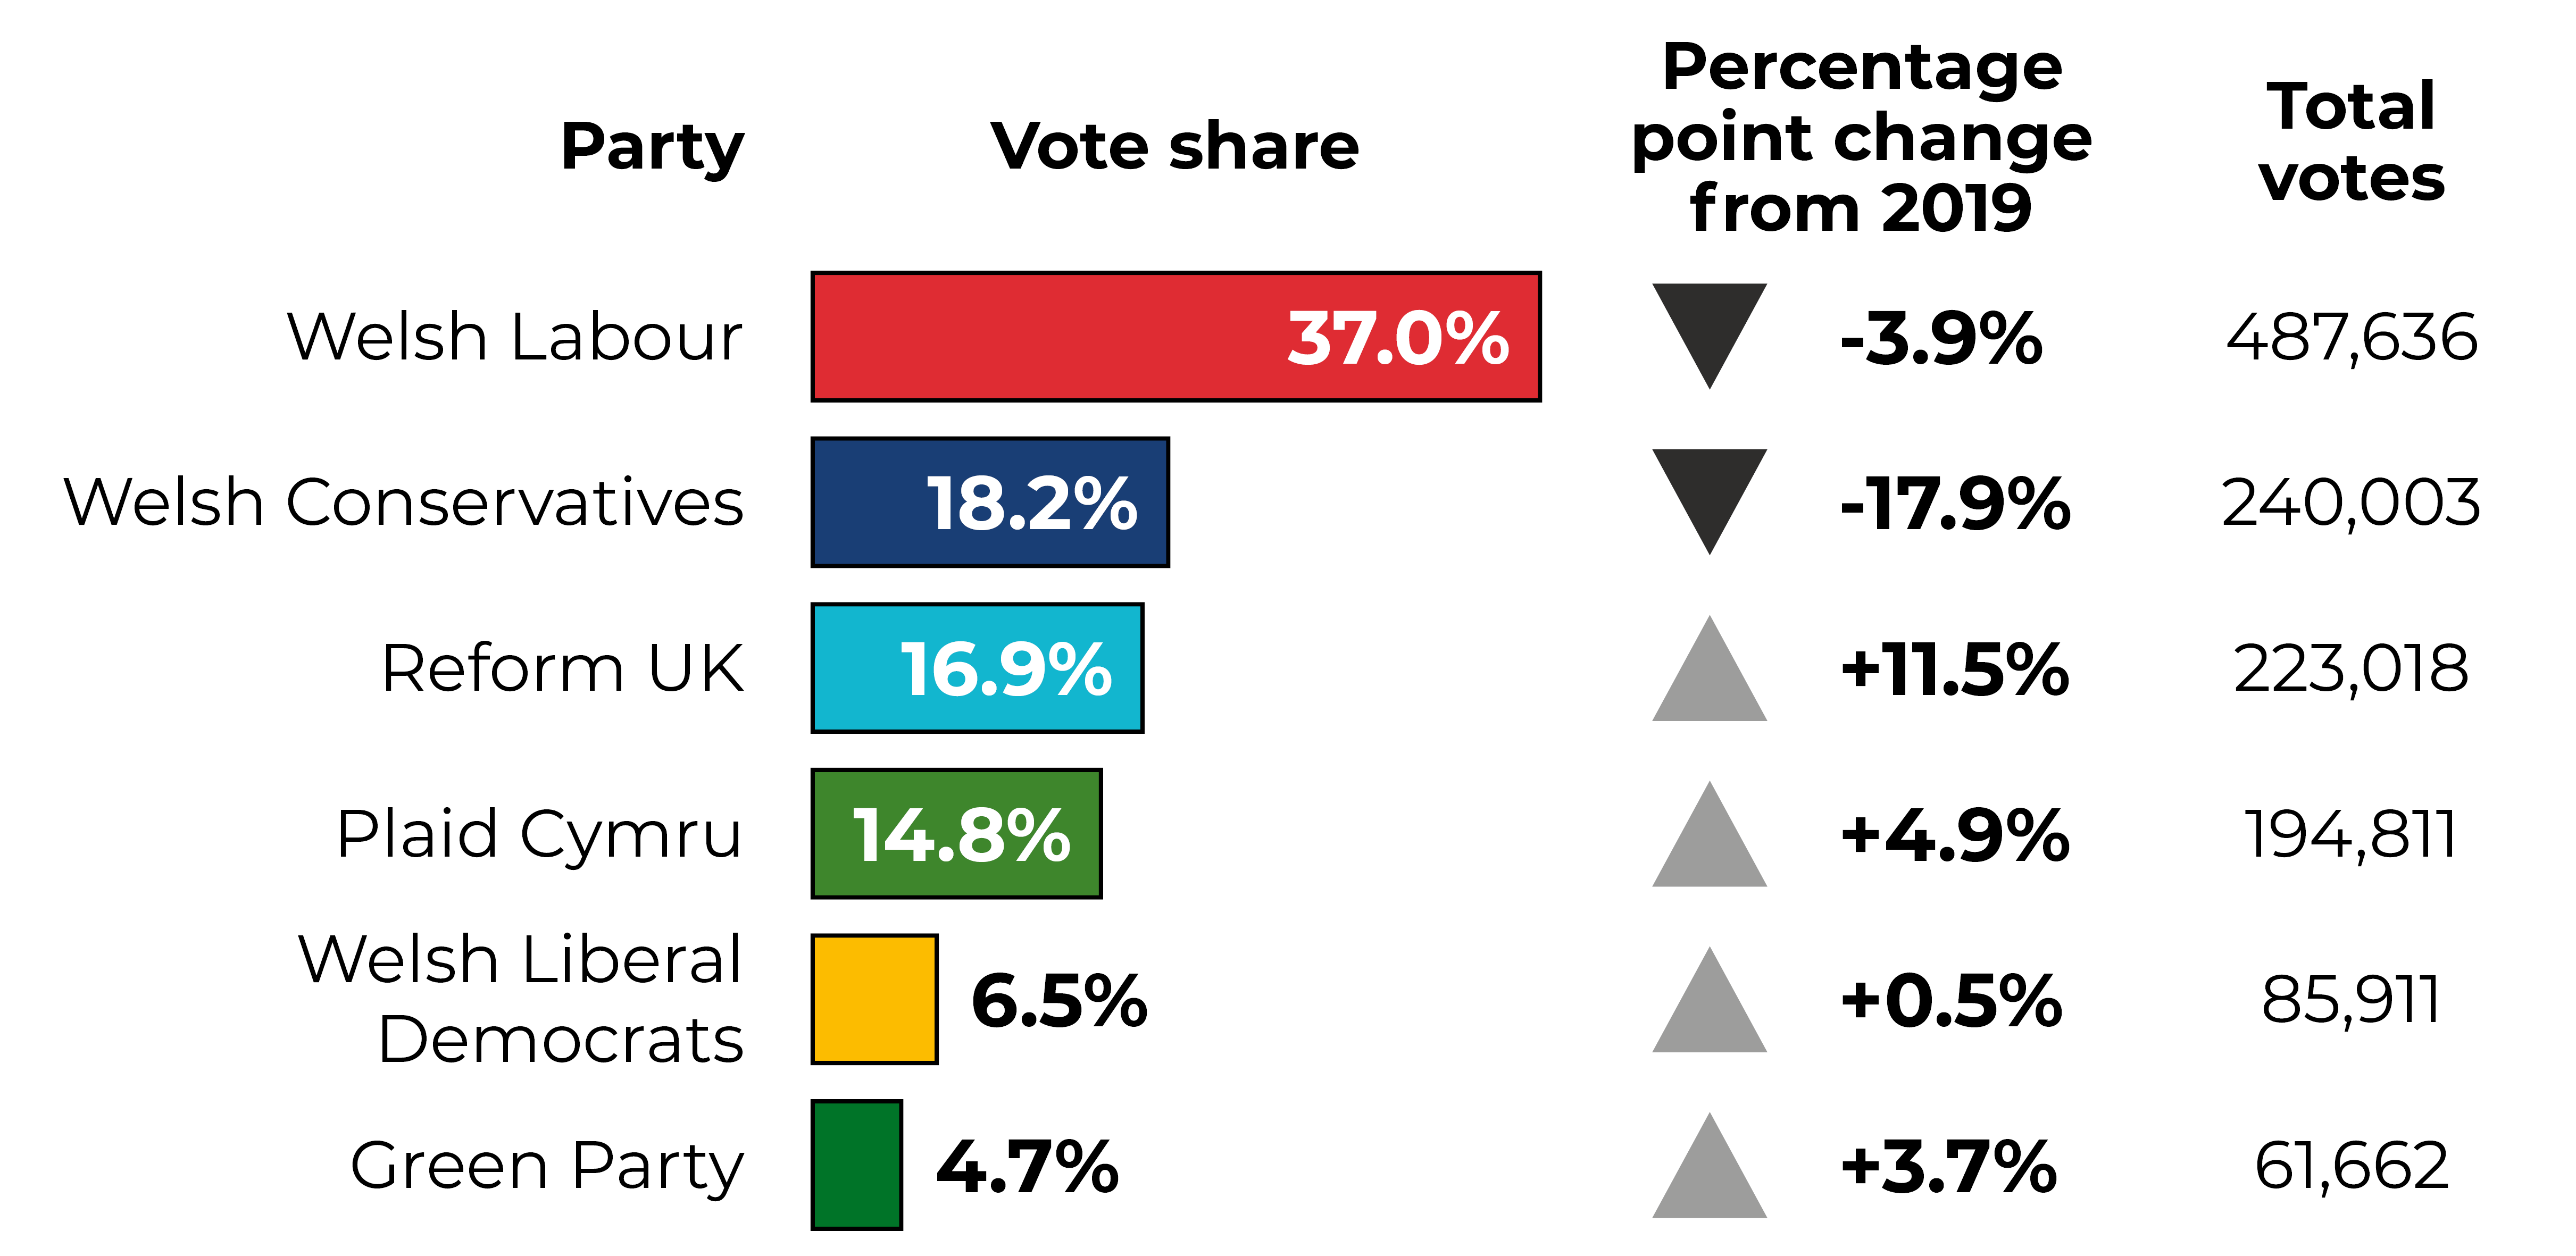
Source: BBC
While Labour won a majority of seats in Wales, the party’s overall vote share dropped 3.9% points compared with 2019.
The Conservatives saw a substantial drop in vote share, down 17.9% points from 2019. Whilst Reform UK did not win a seat, the party came third in terms of total votes received, behind Labour and the Conservatives.
Plaid Cymru recorded its highest ever vote share at a general election, winning 14.8% of the vote.
Figure 6: Vote share for parties since 2015
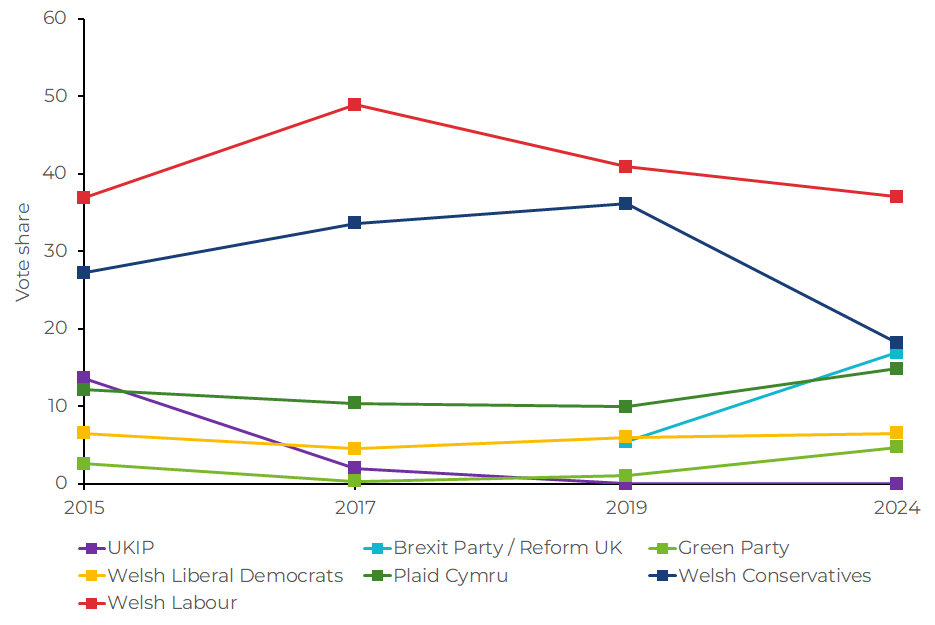
Source: BBC 2015 / BBC 2017 / BBC 2019 / BBC 2024
The above chart shows that Labour has consistently won the highest number votes cast in Wales at general elections. The election in 2019 saw a narrowing between Labour and the Conservatives. However, with the latter losing 17.9% points of its vote share at this election, the gap has widened again.
Also of note is the decline of the UKIP vote share and subsequent rise of the Brexit Party / Reform UK. Only 1 UKIP candidate stood in Wales at this election, in Llanelli.
Majorities
Figure 7: Majority sizes for each constituency, ordered from largest to smallest
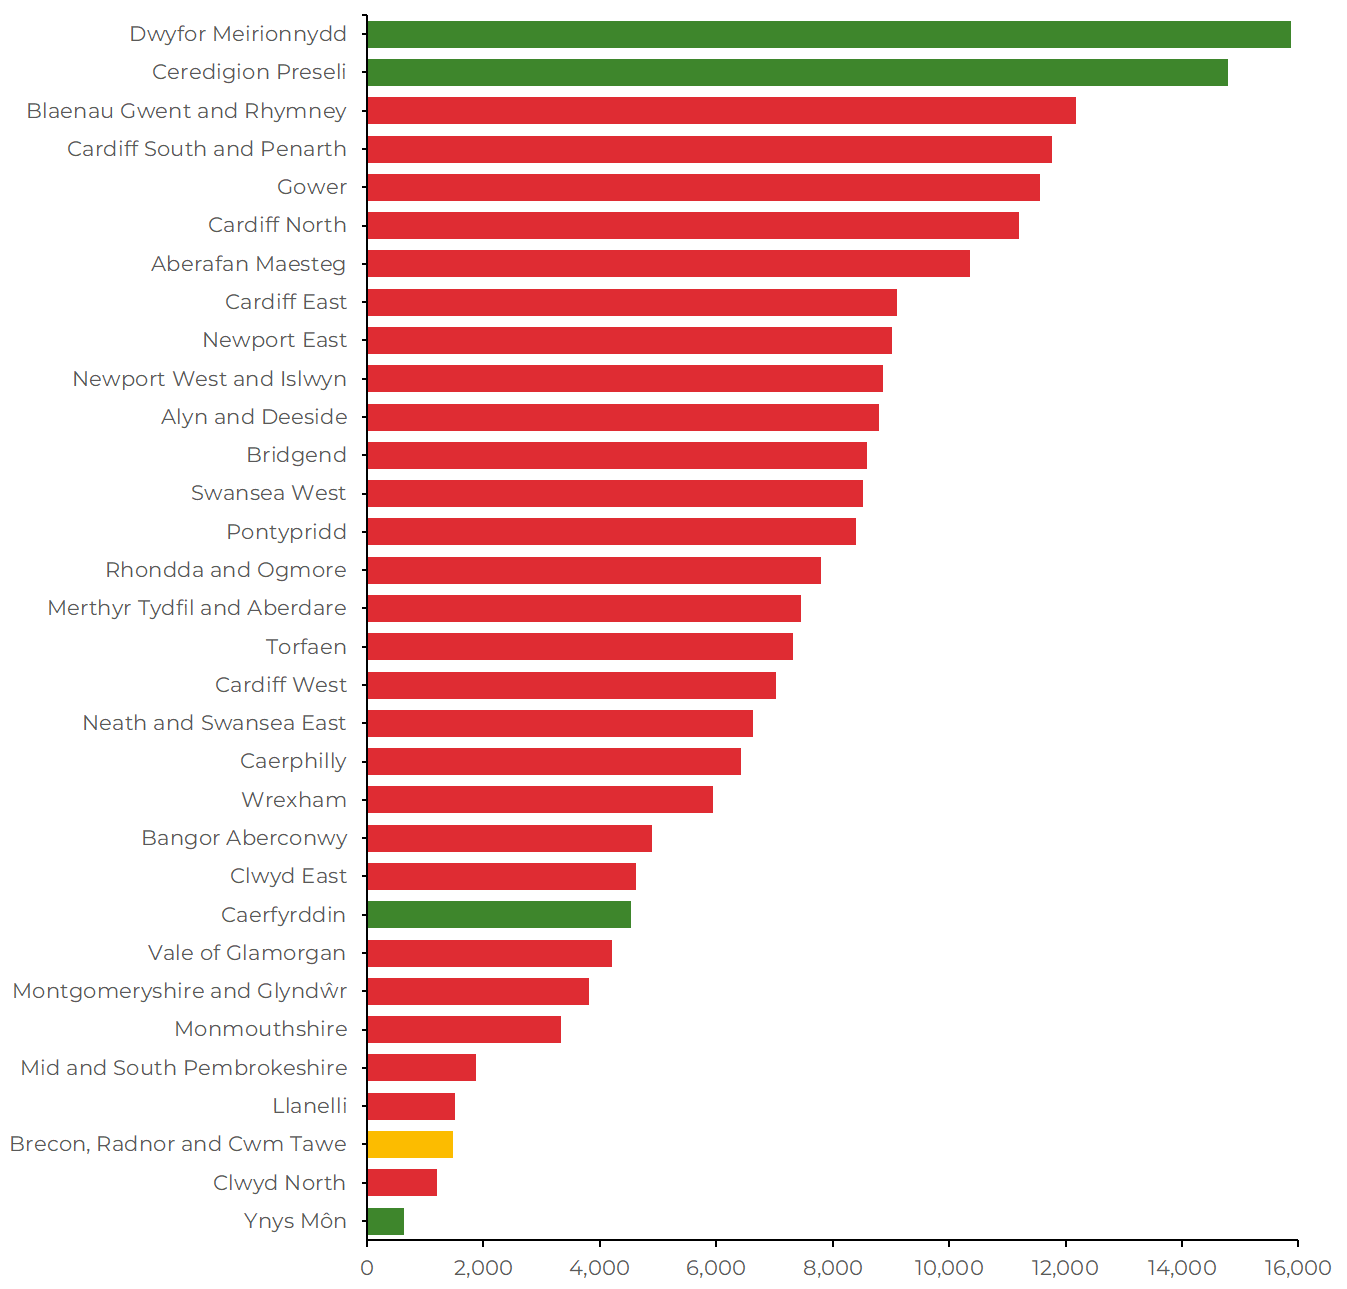
Source: BBC
Plaid Cymru won with the two largest majorities, in Dwyfor Meirionydd and Ceredigion Preseli (15,876 and 14,789 votes respectively). The next largest majority was Blaenau Gwent and Rhymney, which Labour won by 12,183 votes.
Plaid Cymru also won the seat with the smallest majority – Ynys Môn (637 votes). Large majorities on Ynys Môn have been rare in recent years; the constituency has been won by three different parties at the last three elections.
The second smallest majority was Labour’s win in Clwyd North at 1,196 votes, followed by the Liberal Democrats’ only seat, Brecon, Radnor and Cwm Tawe, at 1,472 votes.
Turnout
At both a UK and Wales level, turnout was down at this general election. The drop in Wales was larger, from 67% to 56%.
This was the first UK General Election for which voters were required to bring photographic ID when voting. Our article on the 2024 Police and Crime Commissioners elections explored debates around the introduction of a voter ID requirement and its potential impact on turnout.
Figure 8: Turnout at general elections in Wales
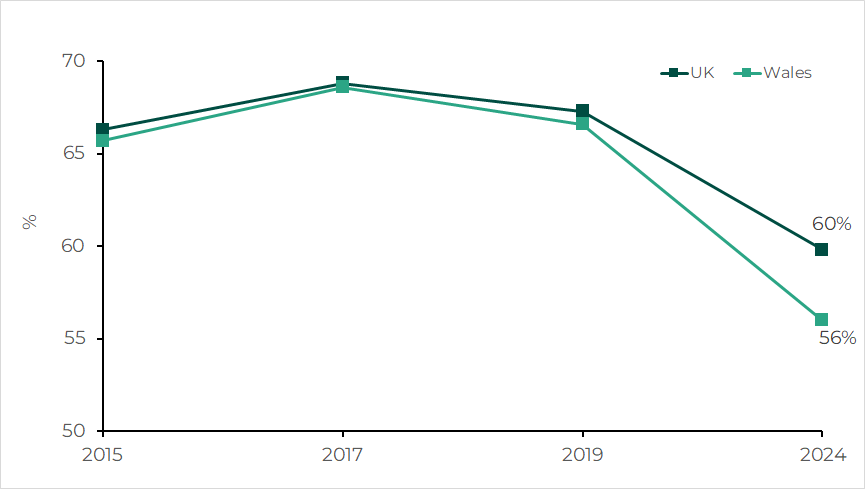
Source: House of Commons Library 2015 / House of Commons Library 2017 / House of Commons Library 2019 / BBC
Considering turnout at individual constituency levels reveals some interesting patterns.
Figure 9: Turnout for each constituency, ordered from highest to lowest
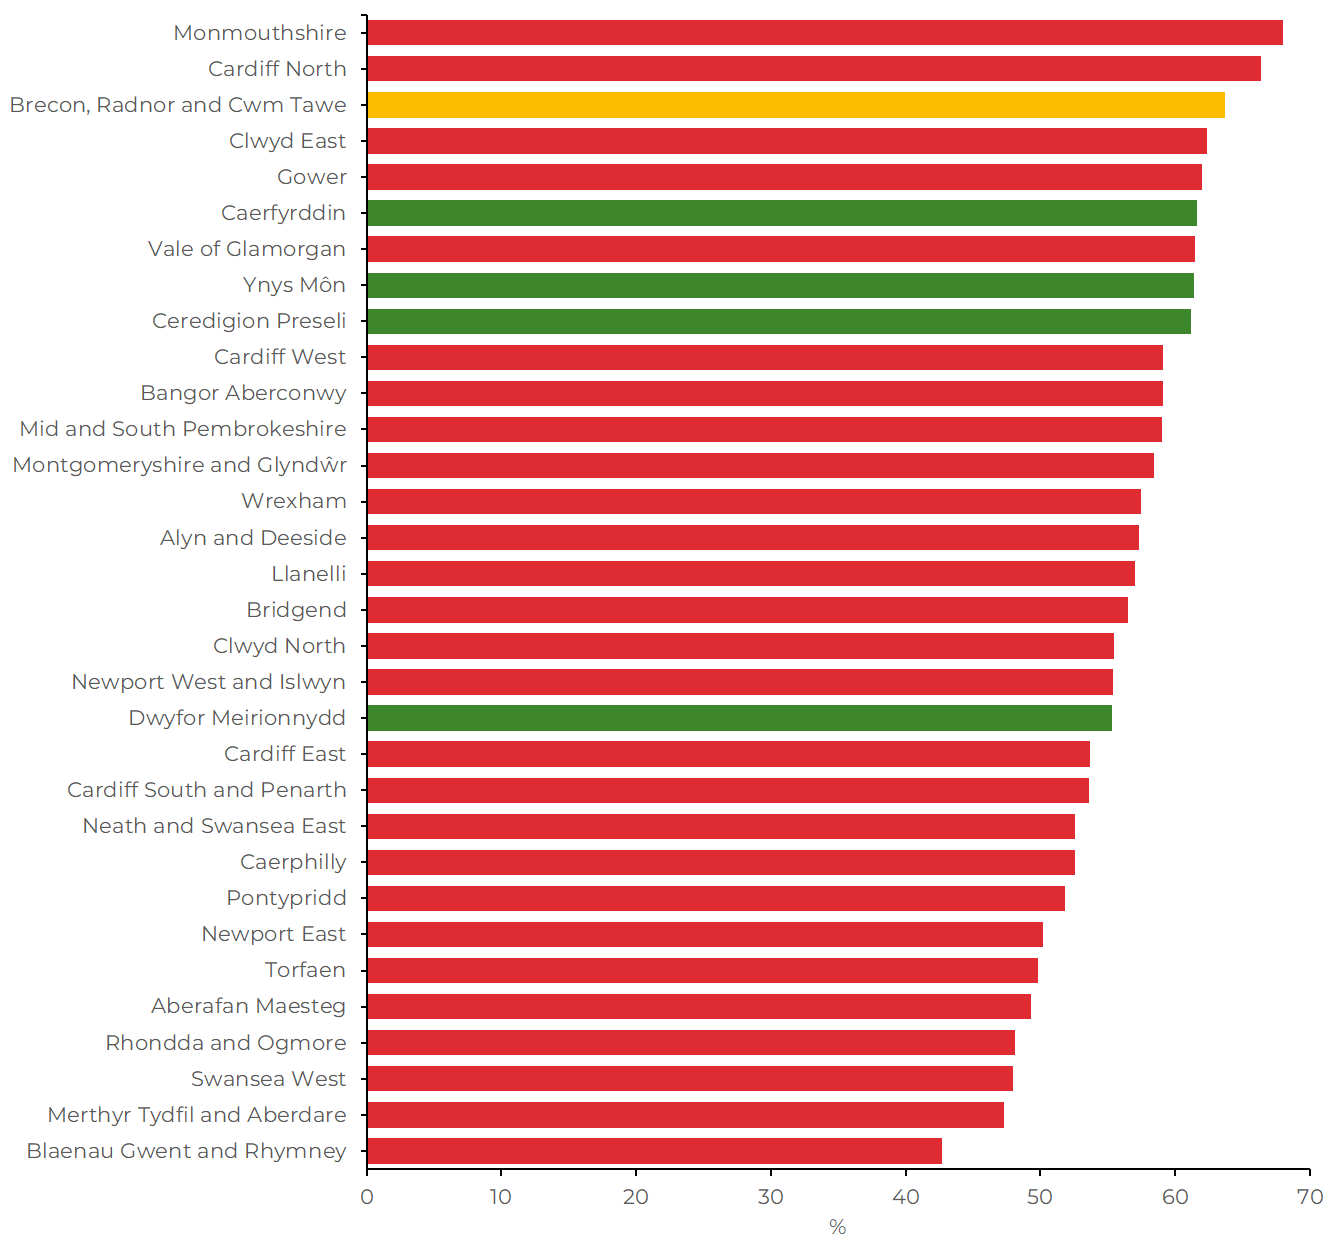
Source: House of Commons Library
Whilst constituency boundaries have changed somewhat, Monmouthshire (formerly Monmouth), Cardiff North, and Brecon, Radnor and Cwm Tawe (formerly Brecon and Radnorshire) have been the three constituencies with the highest turnout levels at the 2015, 2017, 2019 and 2024 general elections.
Merthyr Tydfil and Aberdare (formerly Merthyr Tydfil and Rhymney) has consistently ranked in the bottom three at recent general elections (in 2005, 2010, 2015, 2017 and 2019) in terms of turnout.
Article by Adam Cooke, Senedd Research, Welsh Parliament
