On 2 May 2024, voters in Wales had the chance to choose their four Police and Crime Commissioners (PCCs). Our article explored the role PCCs play in policing in Wales.
The elections marked the first time in Wales that voters were required to bring photographic ID to polling stations. It was also the first time that the first-past-the-post voting system was used in PCC elections, replacing the Supplementary Vote system.
This article looks at the 2024 election results and analyses voter turnout levels at PCC elections over the years.
Who was elected?
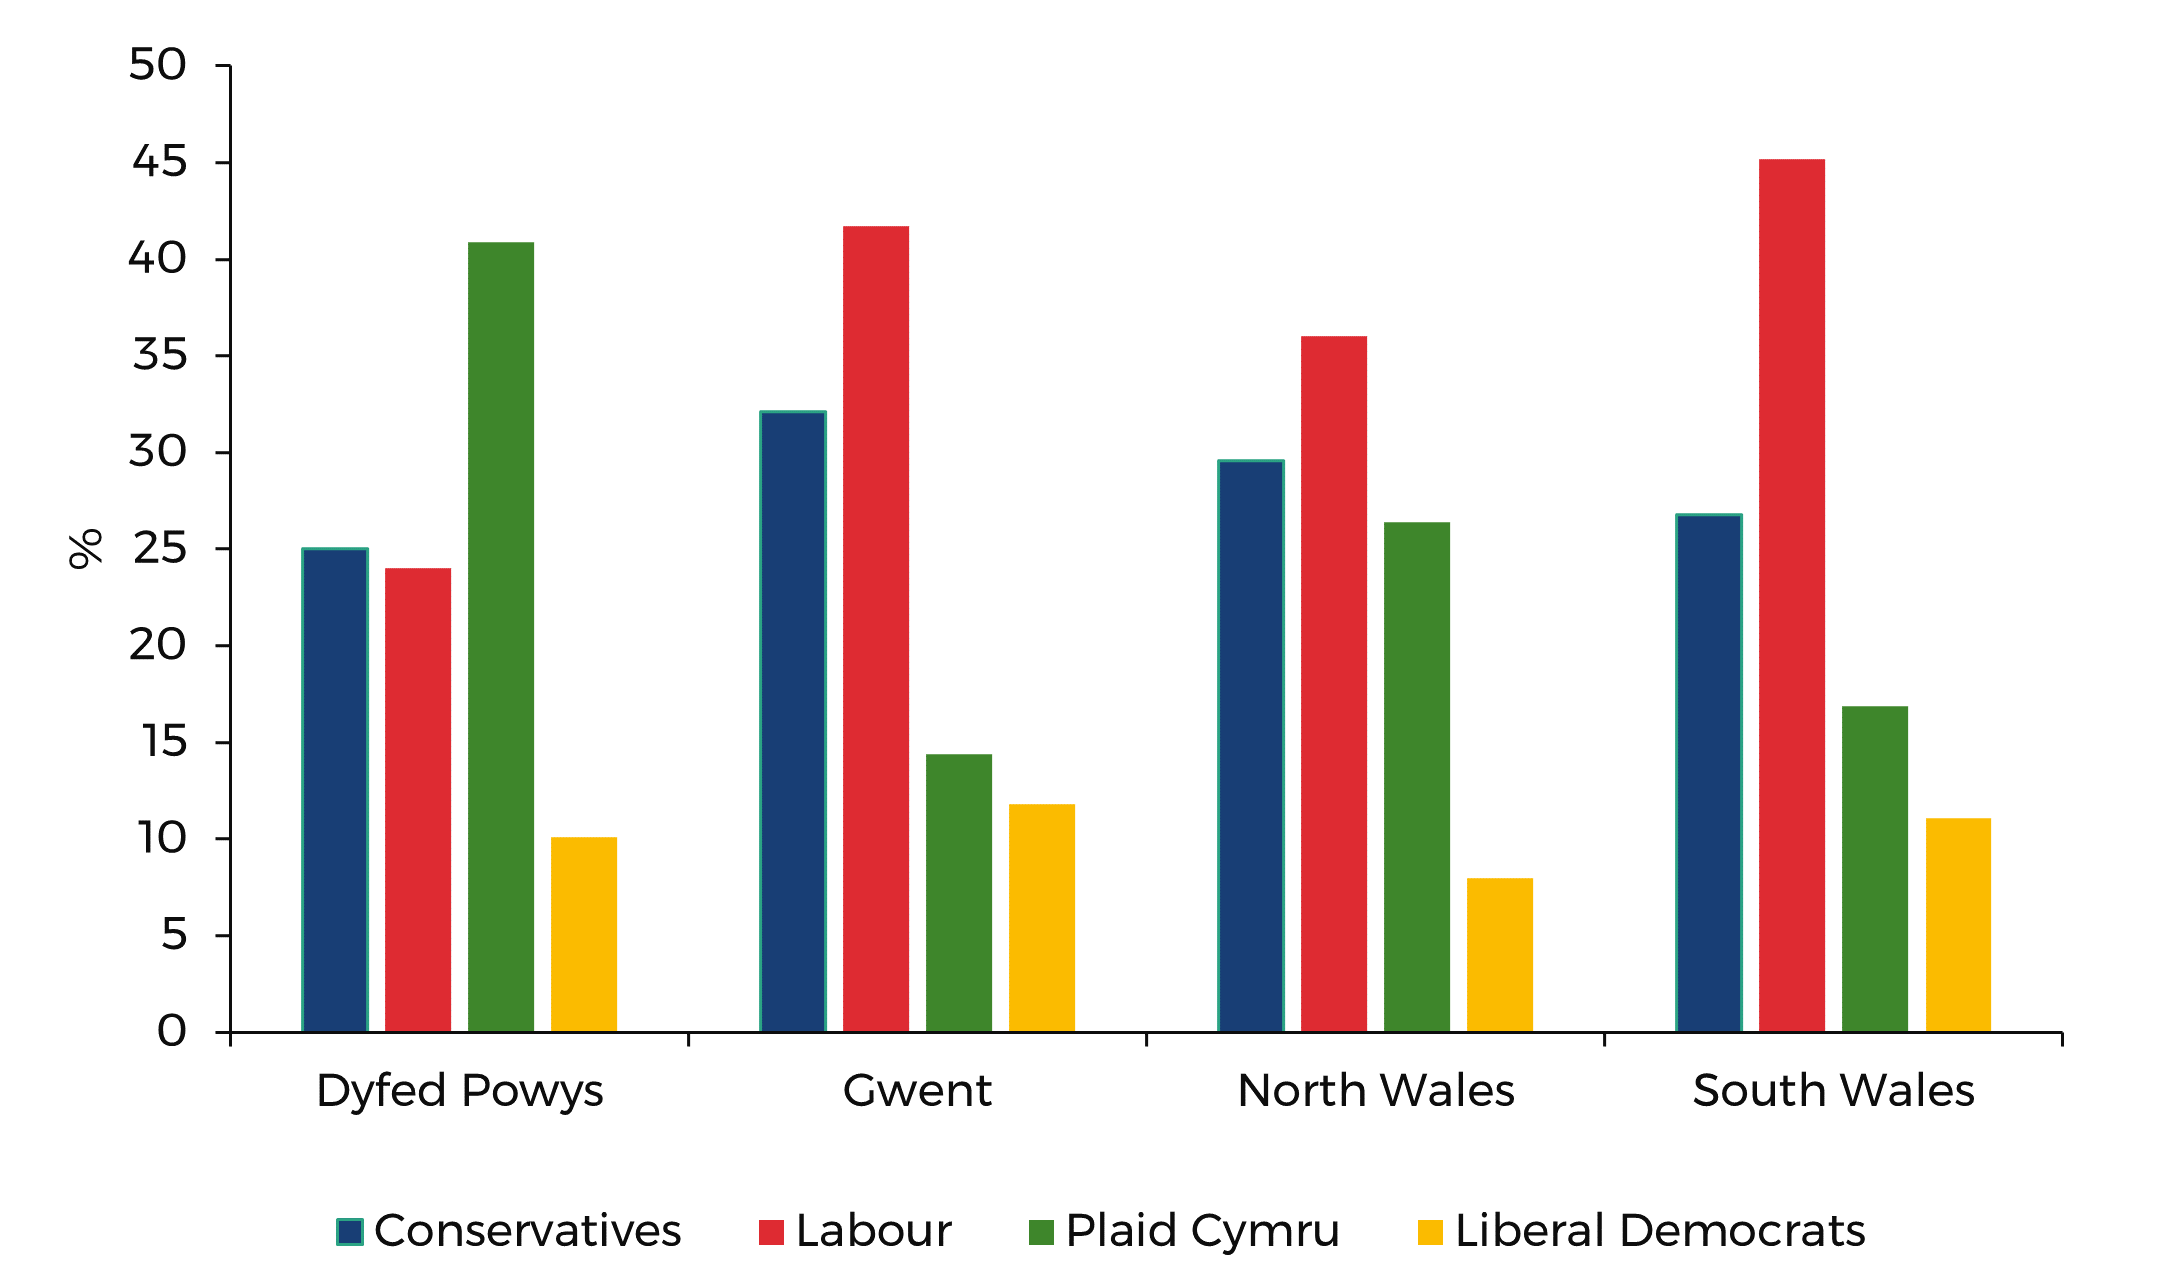
Figure 1: Vote share in the 2024 PCC elections

Source: BBC News
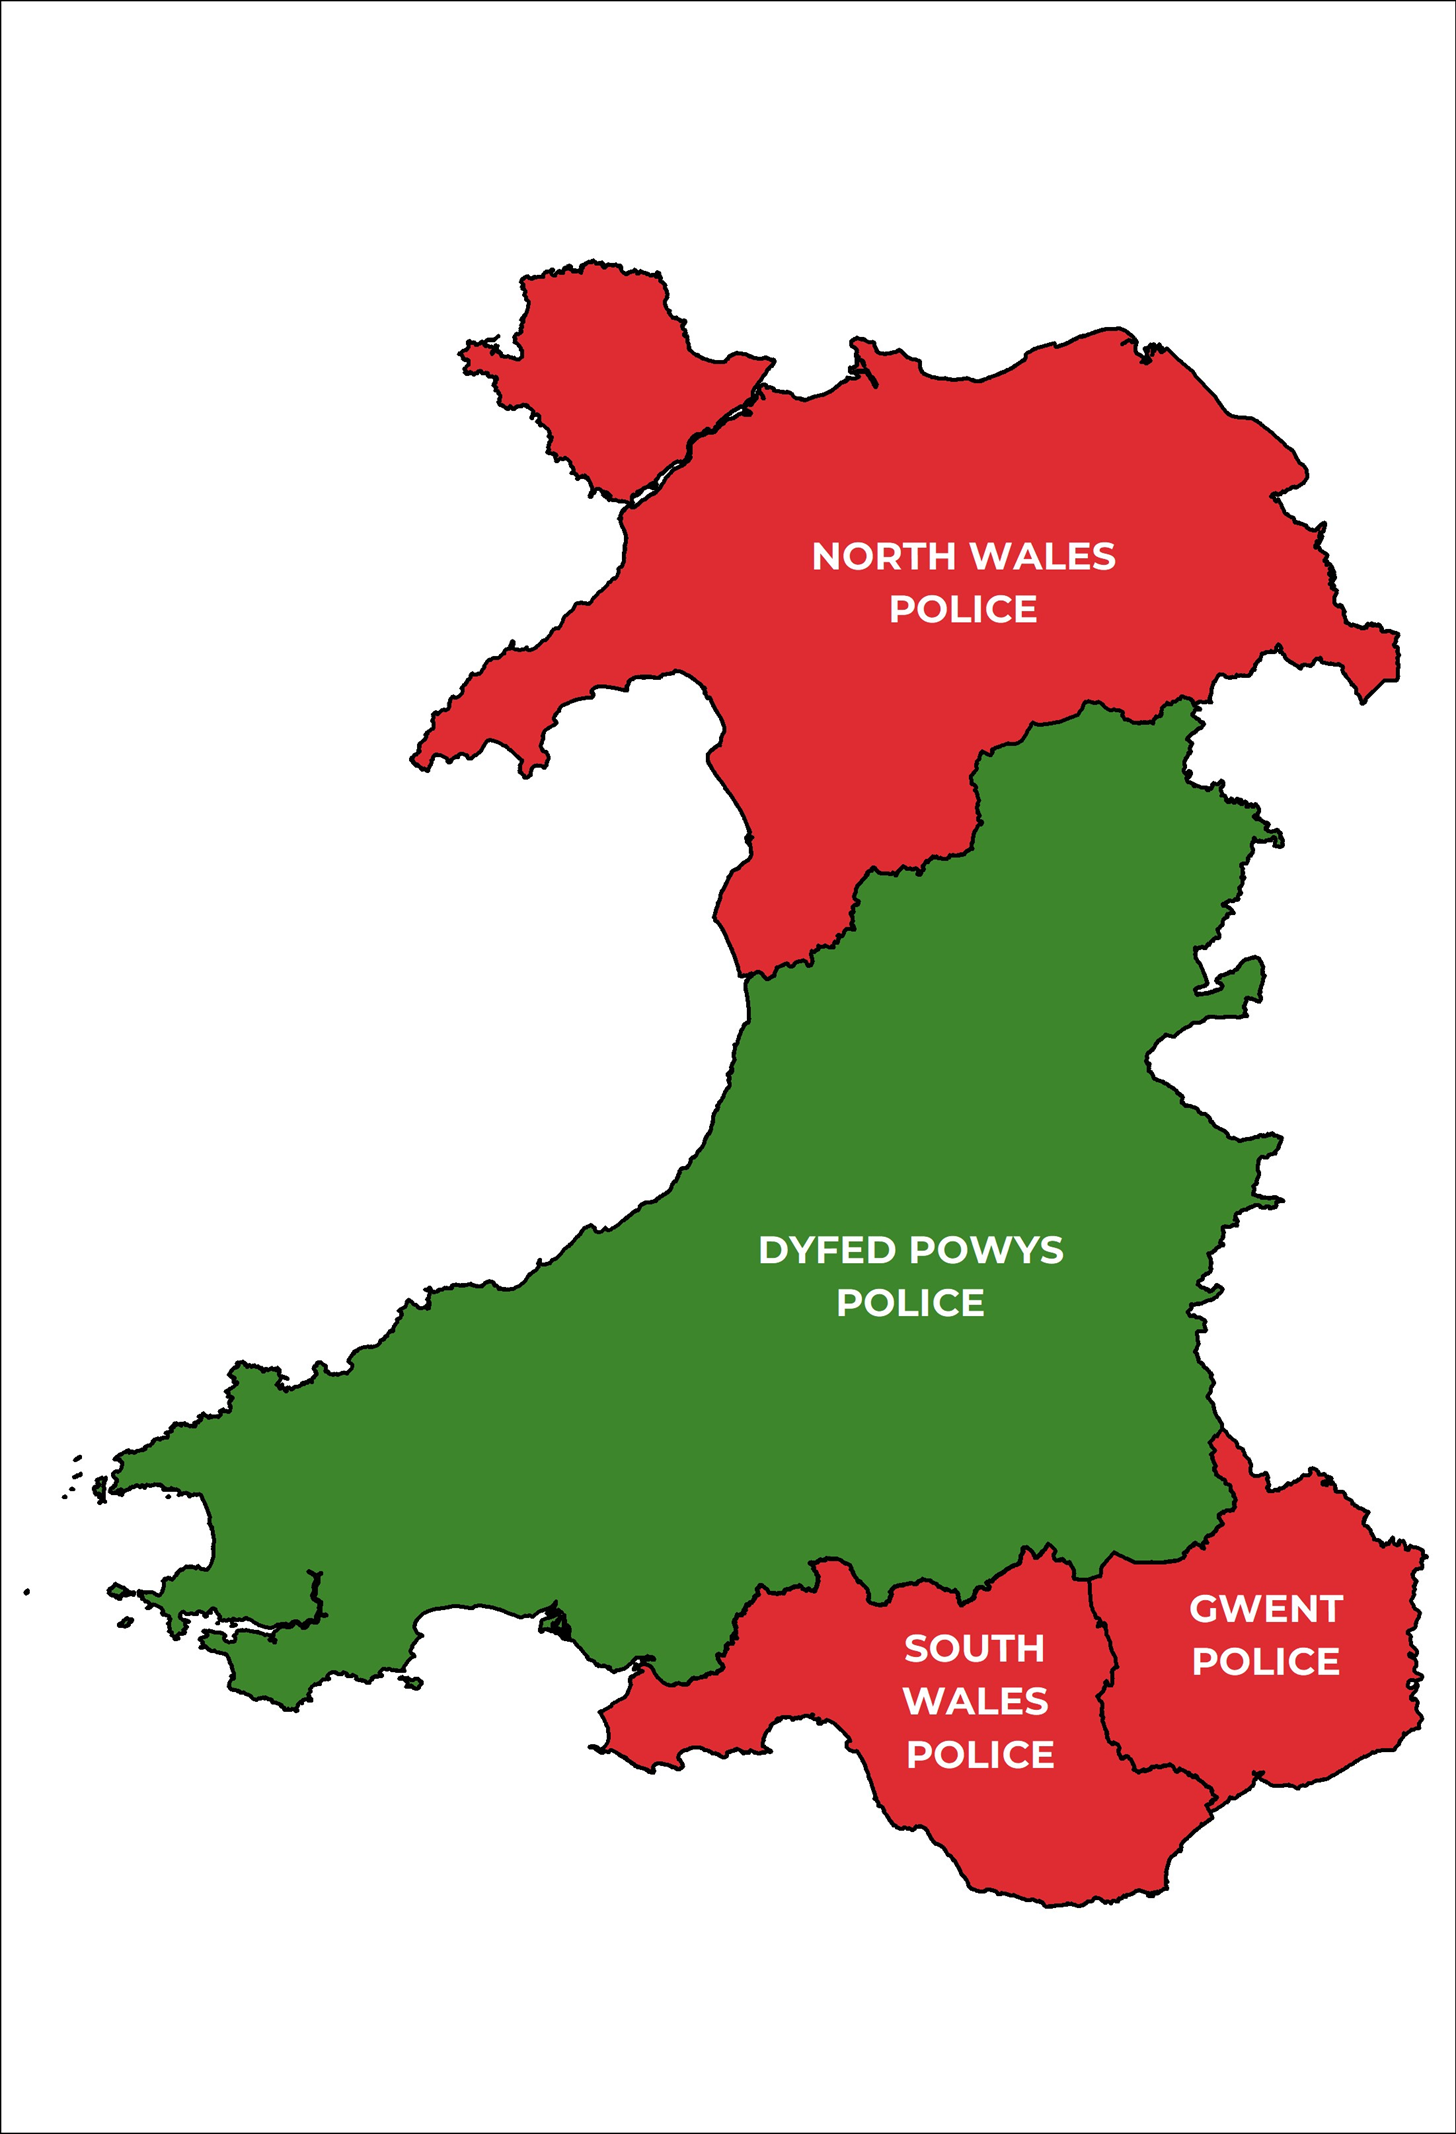
Plaid Cymru’s Dafydd Llywelyn held his position in Dyfed Powys, as did Labour’s Andy Dunbobbin in North Wales.
Labour also held its seats in Gwent and South Wales but with new candidates as previous post holders stood down. Significantly, with the election of Jane Mudd (Gwent) and Emma Wools (South Wales), Wales has its first female PCCs. Emma Wools is also the first black female PCC to be elected in the UK.
Looking at a map of police areas in Wales, nothing has changed in terms of party representation; seat distribution remains the same as it was in 2021:
Figure 2: Police areas and party representation

Source: Senedd Research
What was the turnout?
Levels of voter turnout were in the media spotlight, considering the historically low levels of engagement in previous PCC elections and the introduction of the need for voter ID in Wales.
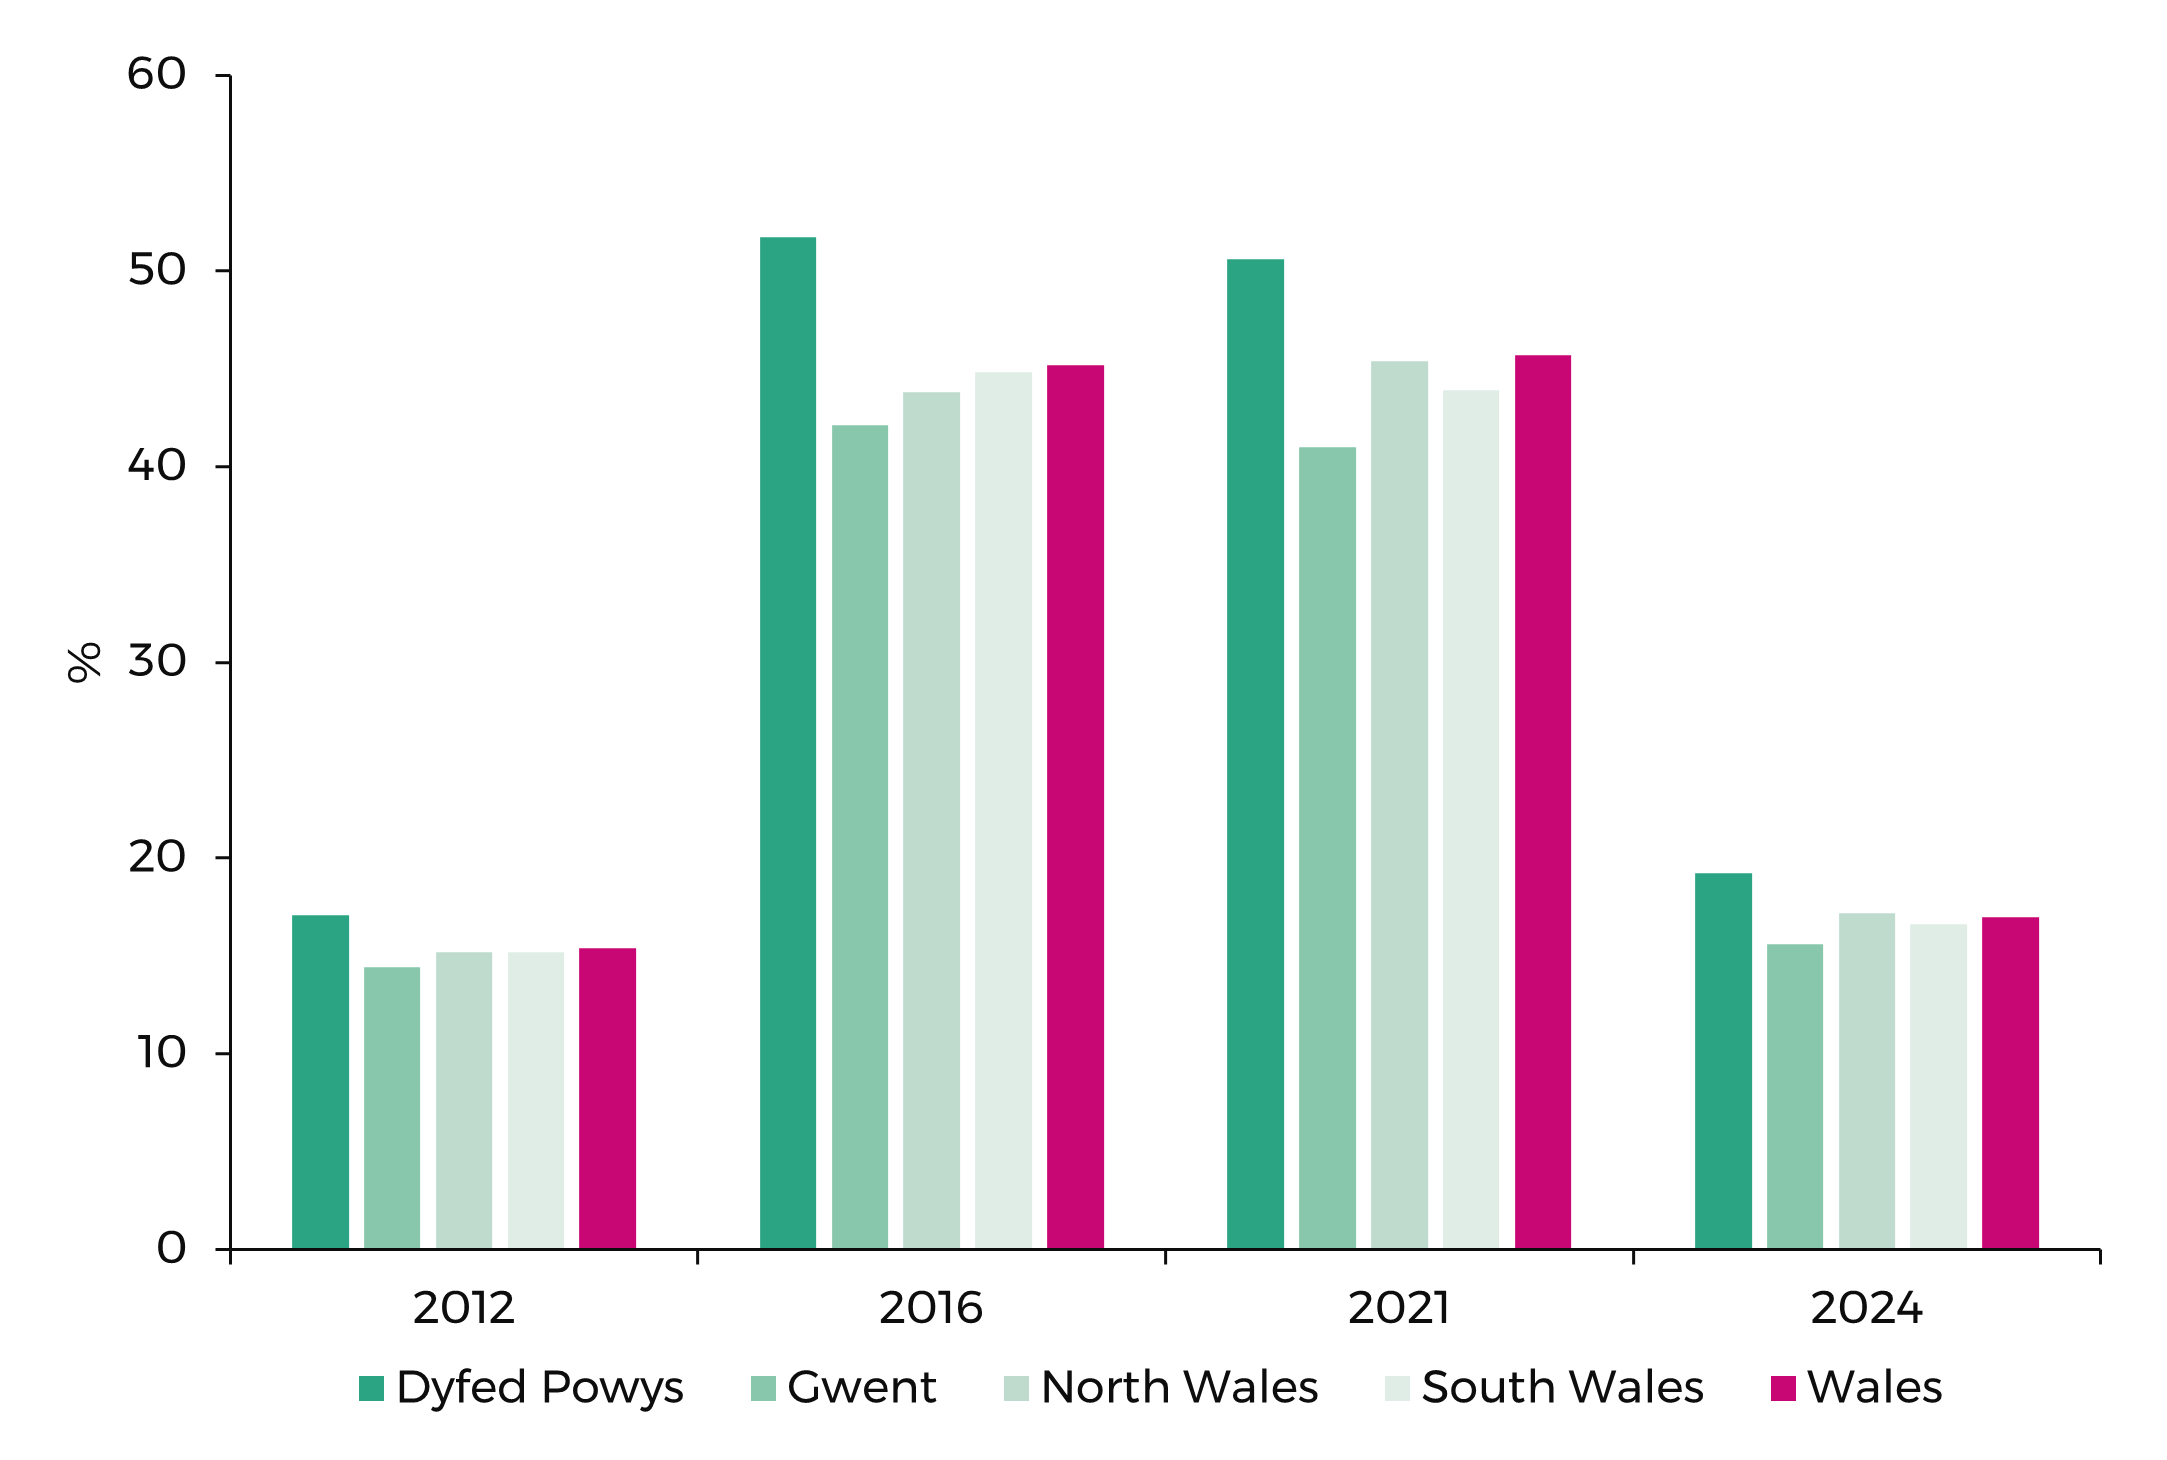
Figure 3: Turnout levels in PCC elections, 2012-2024

Sources: Electoral Commission, House of Commons Library, BBC News.
Turnout for 2024 elections is sourced from initial reports by the BBC. This will be updated as official results are published by the Electoral Commission. Methodology for counting the 2024 turnout may therefore differ between sources of these initial reports.
These initial media reports suggest that turnout for 2024 is comparable, and indeed slightly higher, than levels reached in 2012. Overall turnout in Wales is reported as 17% for the recent elections, compared with 15.4% in 2012. Gwent is reported as having the lowest level of turnout, with levels highest in Dyfed Powys. This has been the pattern for every PCC election so far.
Initial reports suggest that, in some areas, a significant number of votes were cast by postal vote. It is not yet clear whether the introduction of voter ID had an impact.
Looking back at previous years, the turnout data for 2012 (see also) and 2016 are sourced from the Electoral Commission. The Wales turnout percentage for 2021 also comes from Electoral Commission data, however, turnout for individual police areas in 2021 is based on House of Commons Library data.
The 2016 and 2021 elections coincided with elections to the Senedd, therefore turnout was significantly higher than in 2012 or 2024.
The next PCC elections are due to take place in 2028.
Article by Adam Cooke, Senedd Research, Welsh Parliament


